
As you may be aware, the JDK 8 Early Access is now available for download. This allows Java developers to experiment with some of the new language and runtime features of Java 8. One of these features is the complete removal of the Permanent Generation (PermGen) space which has been announced by Oracle since the release of JDK 7. Interned strings, for example, have already been removed from the PermGen space since JDK 7. The JDK 8 release finalizes its decommissioning. This article will share the information that we found so far on the PermGen successor: Metaspace. We will also compare the runtime behavior of the HotSpot 1.7 vs. HotSpot 1.8 (b75) when executing a Java program “leaking” class metadata objects. The final specifications, tuning flags and documentation around Metaspace should be available once Java 8 is officially released.
Metaspace:
A new memory space is born
The JDK 8 HotSpot JVM is now using native memory for the representation of class metadata and is called Metaspace; similar to the Oracle JRockit and IBM JVM’s. The good news is that it means no more java.lang.OutOfMemoryError: PermGen space problems and no need for you to tune and monitor this memory space anymore…not so fast. While this change is invisible by default, we will show you next that you will still need to worry about the class metadata memory footprint. Please also keep in mind that this new feature does not magically eliminate class and classloader memory leaks. You will need to track down these problems using a different approach and by learning the new naming convention. I recommend that you read the PermGen removal summary and comments from Jon on this subject.
In summary:
PermGen space situation
- This memory space is completely removed.
- The PermSize and MaxPermSize JVM arguments are ignored and a warning is issued if present at start-up.
Metaspace memory allocation model
- Most allocations for the class metadata are now allocated out of native memory.
- The klasses that were used to describe class metadata have been removed.
Metaspace capacity
- By default class metadata allocation is limited by the amount of available native memory (capacity will of course depend if you use a 32-bit JVM vs. 64-bit along with OS virtual memory availability).
- A new flag is available (MaxMetaspaceSize), allowing you to limit the amount of native memory used for class metadata. If you don’t specify this flag, the Metaspace will dynamically re-size depending of the application demand at runtime.
Metaspace garbage collection
- Garbage collection of the dead classes and classloaders is triggered once the class metadata usage reaches the “MaxMetaspaceSize”.
- Proper monitoring & tuning of the Metaspace will obviously be required in order to limit the frequency or delay of such garbage collections. Excessive Metaspace garbage collections may be a symptom of classes, classloaders memory leak or inadequate sizing for your application.
Java heap space impact
- Some miscellaneous data has been moved to the Java heap space. This means you may observe an increase of the Java heap space following a future JDK 8 upgrade.
Metaspace monitoring
- Metaspace usage is available from the HotSpot 1.8 verbose GC log output.
- Jstat & JVisualVM have not been updated at this point based on our testing with b75 and the old PermGen space references are still present.
Enough theory now, let’s see this new memory space in action via our leaking Java program…
PermGen vs. Metaspace runtime comparison
In order to better understand the runtime behavior of the new Metaspace memory space, we created a class metadata leaking Java program. You can download the source here.
The following scenarios will be tested:
- Run the Java program using JDK 1.7 in order to monitor & deplete the PermGen memory space set at 128 MB.
- Run the Java program using JDK 1.8 (b75) in order to monitor the dynamic increase and garbage collection of the new Metaspace memory space.
- Run the Java program using JDK 1.8 (b75) in order to simulate the depletion of the Metaspace by setting the MaxMetaspaceSize value at 128 MB.
JDK 1.7 @64-bit – PermGen depletion
- Java program with 50K configured iterations
- Java heap space of 1024 MB
- Java PermGen space of 128 MB (-XX:MaxPermSize=128m)
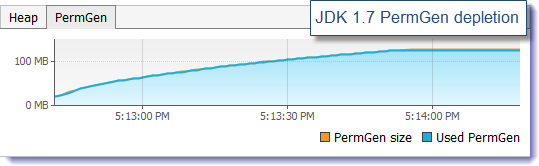
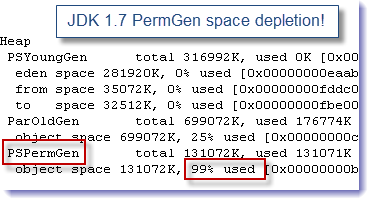
As you can see form JVisualVM, the PermGen depletion was reached after loading about 30K+ classes. We can also see this depletion from the program and GC output.
1 |
Class metadata leak simulator |
2 |
3 |
Author: Pierre-Hugues Charbonneau |
4 |
6 |
7 |
ERROR: java.lang.OutOfMemoryError: PermGen space |
Now let’s execute the program using the HotSpot JDK 1.8 JRE.
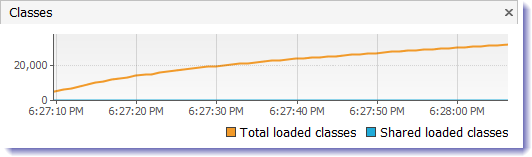
JDK 1.8 @64-bit – Metaspace dynamic re-size
- Java program with 50K configured iterations
- Java heap space of 1024 MB
- Java Metaspace space: unbounded (default)
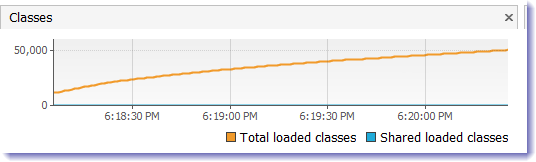
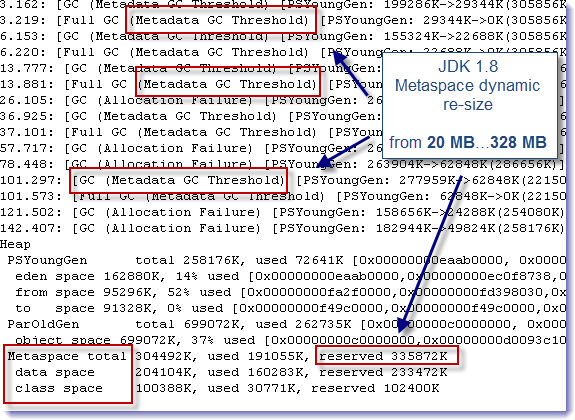
As you can see from the verbose GC output, the JVM Metaspace did expand dynamically from 20 MB up to 328 MB of reserved native memory in order to honor the increased class metadata memory footprint from our Java program. We could also observe garbage collection events in the attempt by the JVM to destroy any dead class or classloader object. Since our Java program is leaking, the JVM had no choice but to dynamically expand the Metaspace memory space. The program was able to run its 50K of iterations with no OOM event and loaded 50K+ Classes. Let’s move to our last testing scenario.
JDK 1.8 @64-bit – Metaspace depletion
- Java program with 50K configured iterations
- Java heap space of 1024 MB
- Java Metaspace space: 128 MB (-XX:MaxMetaspaceSize=128m)
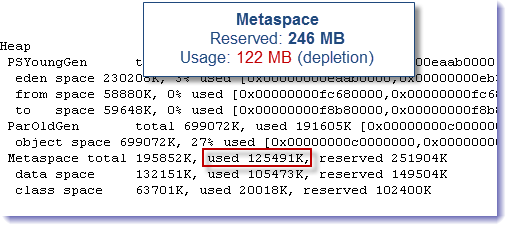
As you can see form JVisualVM, the Metaspace depletion was reached after loading about 30K+ classes; very similar to the run with the JDK 1.7. We can also see this from the program and GC output. Another interesting observation is that the native memory footprint reserved was twice as much as the maximum size specified. This may indicate some opportunities to fine tune the Metaspace re-size policy, if possible, in order to avoid native memory waste.
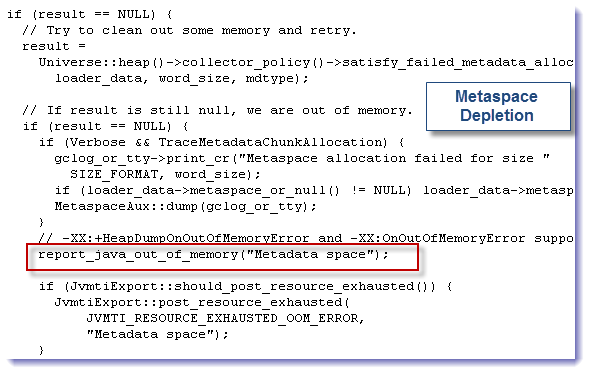
Now find below the Exception we got from the Java program output.
1 |
Class metadata leak simulator |
2 |
3 |
Author: Pierre-Hugues Charbonneau |
4 |
6 |
7 |
ERROR: java.lang.OutOfMemoryError: Metadata space |
Done!
As expected, capping the Metaspace at 128 MB like we did for the baseline run with JDK 1.7 did not allow us to complete the 50K iterations of our program. A new OOM error was thrown by the JVM. The above OOM event was thrown by the JVM from the Metaspace following a memory allocation failure.
#metaspace.cpp
Final words
I hope you appreciated this early analysis and experiment with the new Java 8 Metaspace. The current observations definitely indicate that proper monitoring & tuning will be required in order to stay away from problems such as excessive Metaspace GC or OOM conditions triggered from our last testing scenario. Future articles may include performance comparisons in order to identify potential performance improvements associated with this new feature.


相关推荐
java.lang.OutOfMemoryError: PermGen space 解决方案
Caused by: java.lang.OutOfMemoryError: PermGen space解决方案, avax.servlet.ServletException: java.lang.OutOfMemoryError: PermGen space at org.apache.jasper.servlet.JspServlet.service(JspServlet.java...
java.lang.OutOfMemoryError: PermGen space及其解决方法,解决项目太大tomcat内存溢出
java.lang.OutOfMemoryError: PermGen space
主要介绍了Java8内存模型PermGen Metaspace实例解析,文中通过示例代码介绍的非常详细,对大家的学习或者工作具有一定的参考学习价值,需要的朋友可以参考下
解决OutOfMemoryError: PermGen space,过程是痛苦的,结果是舒畅的
Tomcat给我的java.lang.OutOfMemoryError: ... PermGenTomcat给我的java.lang.OutOfMemoryError: PermGenTomcat给我的java.lang.OutOfMemoryError: PermGenTomcat给我的java.lang.OutOfMemoryError: PermGen
tomcat内存溢出解决办法,错误信息:java.lang.OutOfMemoryError:PermGen space 参考该文档可快速解决内存溢出的问题,服务器:tomcat
Eclipse中通过Tomcat运行J2EE项目java.lang.OutOfMemoryError PermGen space的解决方案
Java内存溢出之PermGen_OOM
讲述了PermGen space错误解决方法以及PermGen space的出现的几张情况
Java内存不足PermGen space错误探究
PermGen space
Tomcat出现_PermGen_space 以及内存溢出等解决方案
Java8新特性之再见Permgen_动力节点Java学院整理,动力节点口口相传的Java黄埔军校
今天小编就为大家分享一篇关于解决Eclipse Tomcat OutOfMemoryError:PermGen space的问题,小编觉得内容挺不错的,现在分享给大家,具有很好的参考价值,需要的朋友一起跟随小编来看看吧
希望我得文档能帮助您解决问题,来吧,赶紧来看看这篇文档
NULL 博文链接:https://eastzhang.iteye.com/blog/1788854
java的安装 配环境变量,所有版本都支持,不会出错,下完之后你会回来谢我的!!!!!